
The “Fed Put” makes its debut
Readers of this quixotic book, one that attempts to fight back against the deeply embedded human emotion of greed, should be aware that I’ve had a long-running and contentious relationship with bubbles. And though we just made our way to the present, let’s take another brief look at market history and my own relationship with it.
My life in the financial industry began in 1979 when Jimmy Carter was president and inflation was the scourge du jour. For those readers old enough to remember, I’m not referring to the persistent double-digit price rises we have seen in almost all asset values in recent years, but rather of the CPI variety.
Back in the Carter era, it appeared as though the cost-of-living index was destined to continue rising at an accelerating rate, as it had done for most of the prior 15 years. That trend, coupled with the concomitant surge by interest rates to unprecedented levels (yields on short-term debt securities exceeded 20% in 1981 during the first year of Ronald Reagan’s presidency), proved to be a toxic combination for US stocks. But those unparalleled rates, engineered by then-Fed chairman Paul Volcker, produced the intended effect. For the first time in a generation, inflation began to crack, and hard. By August of 1982, with the Dow Jones trading at seven times its trailing 12 months’ earnings (versus over 21 as I write this text), the stage was set for the greatest bull market of all-time.
But come the fall of 1987, the market’s price/earnings (P/E) ratio had tripled, and euphoria had replaced despondency among investors. Inflation was rising, as were interest rates. Yet, those threats did little to dispel the market’s incessant march higher, even as computerized trading and a supposedly risk-mitigating strategy called portfolio insurance came to dominate activity.
The infamous crash of 1987 hit in October of that year, bringing U.S. stock prices down 30% in just a few trading sessions. This was despite an economy growing at a rate three times as fast as the 2% snail’s pace that has characterized most of the past twelve years.
As rates on U.S. treasuries crashed in the wake of the 1987 panic and the economy remained robust, stocks quickly regained their lost ground despite widespread fears of a replay of the Great Depression. In short order, lofty valuations were restored… with a considerable assist from the Fed. Then chairman Alan Greenspan flooded Wall Street with enough liquidity to quell the panic. Thus, the legendary “Fed Put” was born. However, the real action was occurring half-way around the world from Wall Street, in the Land of the Rising Sun (and astronomically rising asset prices).
It was during the late 1980s that the ground under the Imperial Palace in Tokyo was supposedly worth more than all the real estate in California. The main Japanese stock index, the Nikkei, was trading at a P/E ratio of roughly 70. It was a bubble such as the world hadn’t seen since the late 1920s. The absurdity of the prices for Japanese stocks and property caused me, for the first time, to find myself in a bubble-busting state of mind.
Unfortunately, I had become convinced Japanese shares were ridiculously overpriced in 1988, when the Nikkei was trading at 20,000 (by the way, as recently as 2015, 27 years later, it was still trading at 20,000!). My belief caused me to urge my clients to sell their positions in some of Japan’s leading companies that I had bought for them in pre-euphoric times. Once this monstrous speculative frenzy climaxed, the Nikkei rose another 100%, topping out at roughly 40,000 and the aforementioned 70x earnings. Suffice to say, I sold somewhat prematurely, something for which I have a great knack.
The reason I rehash this 33-year-old episode, besides being my initial encounter with an unadulterated bubble, was that it proved to be the pattern of my bubble-opposing efforts: being painfully and embarrassingly early in my predictions of the ultimate reckoning. Little did I know at the time that the world, which had largely been bubble-free since the late ‘20s, with a few minor exceptions, was destined to be caught up in a series of these strange phenomena over the next three decades. And I was fated to repeatedly cast myself in the role of Dour Dave, Davie Downer, Doubting David, or any other derisive characterization of my unwillingness to play along with the prevailing giddiness — always at great cost to my psyche and reputation.
Bubble basics
It now seems appropriate, in the early chapters of this book, to consider a basic question: What is a bubble, anyway? Some wags have suggested that a bull market is one in which an investor is a participant while a bubble is one in which he or she isn’t invested. Despite its whimsical tone, I think there is a lot of truth in this simple saying. Over the years, and through serial bubble events, I’ve repeatedly witnessed the extreme logic contortions supposed market gurus go to in order to rationalize nonsensical valuations. Why? Because rampaging bull markets are good, if not great, for business (and bonuses) as discussed below.
As prices on the Bitcoin, et al, went vertical in the fourth quarter of 2017, it was nearly impossible to read or watch any financial news story or show without being continually bombarded by articles or spots about Bitcoin and its less-famous clones. The steeper the slope of the ascent, the more the investing public and the media raved about this remarkable phenomenon. And phenomenal it was, as you can see from the following chart. (In Chapter 10, I will chronicle its even more phenomenal second act.)
Figure 1

Source: Bloomberg, Evergreen Gavekal (March 2017 – December 2018)
The image above is crucial in answering the fundamental question about what constitutes a bubble. Based on over 40 years of market experience, and far too many personal battles with these extreme manifestations of humanity’s avarice, it’s my conviction that the chart needs to look at least somewhat like Bitcoin’s to truly qualify as a full-blown (pun intended) bubble. In other words, at some point in the latter stages of the bull move in whatever, the price-line needs to literally go vertical in order to apply the “B” word.
Despite the increasing frequency of these events over the last 20 years, there are many who don’t believe in bubbles, or at least are unconvinced that they can be identified in real-time. To that point, a U.S. Supreme Court justice once remarked that he couldn’t define pornography, but he could recognize it if he saw it. In my opinion, that’s exactly the situation with bubbles. They defy a precise definition but when you see one, you have to be truly bubble-oblivious to deny their existence.
The fact that so many do turn a blind (or least seriously impaired) eye to them has, in my view, much to do with the incentives. In this regard, please recall the earlier Charlie Munger quote about incentives and outcomes.
Bluntly, for far too many involved in the financial markets, the inducements to pump up asset bubbles are immense and irresistible. The amount of money that flows from the heart of Wall Street through all the veins and arteries of the financial system — banks, brokers, ETFs, mutual funds — is, inarguably, astronomical.
Like croupiers at the world’s biggest craps game, these intermediaries (of which, admittedly, I am one) skim off billions upon billions of riskless gains. After all, it’s not their capital on the line. Rather, it is the trillions in hard-earned money which, if you follow the trail far down enough, leads to ordinary folks, many of whom are retired or nearing retirement. In this era of central bank-eradicated interest rates, these individuals are among the most vulnerable to being lured into stocks by the TINA argument: “There Is No Alternative”, or by the even more primal motivation: FOMO, “Fear of Missing Out”. One of my biggest concerns is that when this monstrous bubble in almost everything implodes, it is going to create enormous hardship for millions of older investors who will have little chance of recouping their deep losses. But more on that in subsequent chapters…
For now, let’s go even further back a few hundred years to the first documented bubble. As almost everyone has heard or read, the Tulip bubble mania — or Tulpenmanie, in Dutch — that gripped Holland in the early 17th century was the first well-publicized bubble. This is perhaps because by then the printing press had been invented. (Ironically, the invention of digital printing presses by present-day central bankers has played a starring role in Bubble 3.0.) Thus, the dissemination of its spectacular rise, and just as spectacular collapse, was easily documented and preserved. (While I have no proof whatsoever, I suspect bubbles go back as far as humans have engaged in trading activity.)
Figure 2
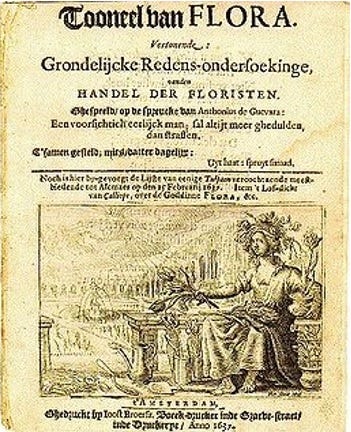
But even with the existence of newspapers, price data from over 350 years ago is at least somewhat suspect. Putting that aspect aside, it is interesting, if not downright fascinating, to compare the purported price behavior of tulips back in 1636 and 1637 to that of Bitcoin in recent years.
Figure 3
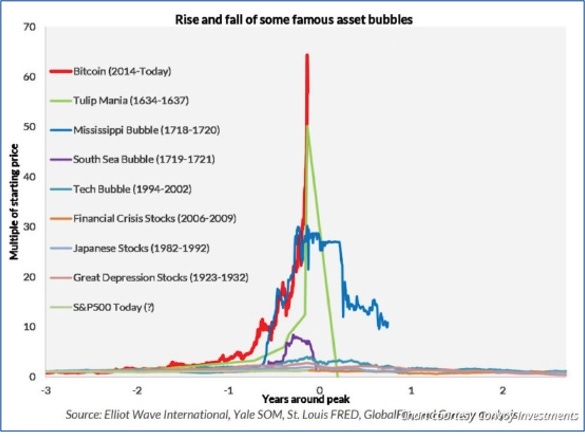
As you can see in the chart above, what we witnessed in 2017 with the cryptos was literally a once-in-a-three-and-a-half-century event. (Yet, as we will see in Chapter 10, the interval between spectacular speculative crazes has shrunk down to a mere three-and-a-half years.)
As you can see in the chart above, what we witnessed in 2017 with the cryptos was literally a once-in-a-three-and-a-half-century event. (Yet, as we will see in Chapter 10, the interval between spectacular speculative crazes has shrunk down to a mere three-and-a-half years.)
Unquestionably, there have been some whopper bubbles since Tulpenmanie, such as the U.S. stock market in the Roaring 20s, the aforementioned mania in Japanese stocks and real estate in the late 1980s, and, of course, the tech bubble in the late 1990s. Consequently, what happened with Bitcoin deserves considerable “credit” in the annals of speculative orgies. (As alluded to earlier, Bitcoin has also managed to do something no previous bubble object has ever achieved before: To crash by 80% and then rise again to even more vertiginous heights in just a few short years.)
Some have dismissed the crypto-craze, at least of 2017, as a niche development that involved only a few tech nerds, some Russian hackers, and a limited number of gullible trend-followers. The reality is that well over $1 trillion was invested in the cryptos themselves, as well as in stocks allegedly linked to them and to their far more reputable underlying technology: Blockchain.
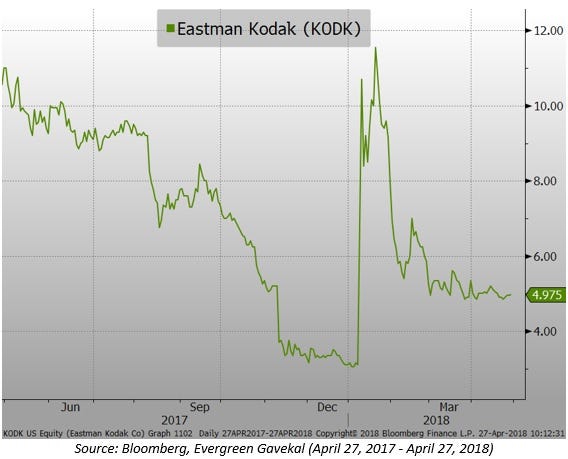
In a precise repeat of the ‘90s dotcom insanity, companies that previously had nothing to do with either Bitcoin or Blockchain saw their stock prices explode by simply changing their name to include some reference to either B-word or announcing their business model now included something related to them (as in the case of the formerly bankrupt Eastman Kodak). The charts below give you a tangible idea of how this absurdity played out as 2017 ended (the most humorous might be the former Long Island Iced Tea, which tweaked its name to “Long Blockchain”).
Figure 4
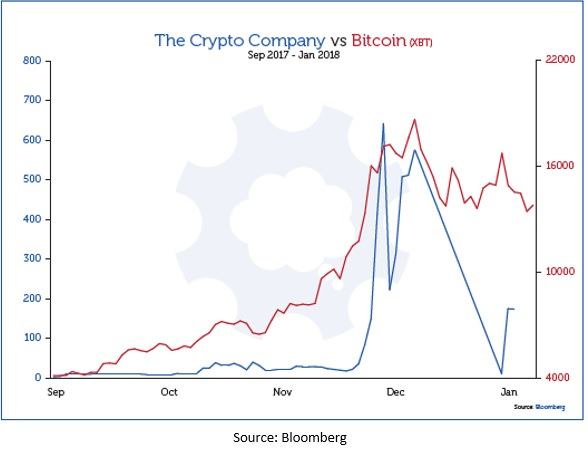
Figure 5

Figure 6
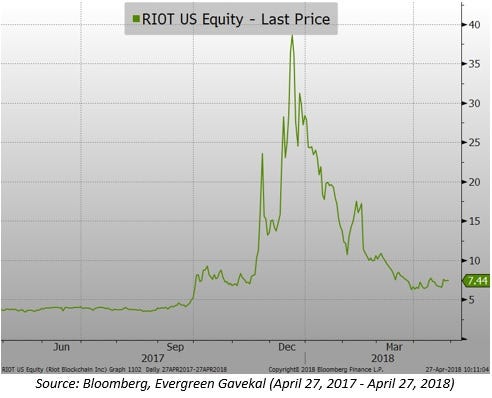
Figure 7
But let’s go back in time again, though not quite as far as 380 years, courtesy of the incomparable Jim Grant. If you’ve never read one of his regular missives — Grant’s Interest Rate Observer — or heard him speak, you have missed one of the 21st century’s (and, for that matter, the 20th century’s) most accomplished financial wordsmiths. In his February 2018, issue, Jim wrote a captivating overview of a less well-known — and another long, long-ago — speculative frenzy: the Mississippi Bubble.
The primary architect of that initially intoxicating, but ultimately unhappy, affair was a Scotsman by the name of John Law. Mr. Law was born a few decades after the Tulip Bulb mania and his subsequent actions seemed to indicate he learned much from that episode. His hurried relocation to France was precipitated by being the winner of a lethal duel (presaging the fate of Aaron Burr a century later who had the same exile experience after fatally shooting the now resurgently popular Alexander Hamilton).
But Law is today notorious, at least among financial historians, for skills well beyond those of a steady-handed marksman or his other latent talent: gambling. Perhaps it was his tendency to turn a quick buck (or franc) that led him to devise his “System”, a means of solving the chronic debt problems of the French monarchy.
Just as U.S. president Richard Nixon would do some 250 years later, Law came up with a plan to ditch that barbarous relic known as gold and replace it with something much less restrictive: paper money; aka, fiat currency. (Please see the Appendix for more background on Nixon’s abandonment of the gold standard.) Unsurprisingly, this episode ended in disaster for both the French people and France’s aristocracy, not to mention Mr. Law himself. But we’ll get into this in more detail in Chapter 6 as we look at the updated version of his economic model, one that America is currently practicing.
Maybe we’ll get lucky, and more bubbles will collapse in on themselves, like the cryptos, without causing systemic damage. But since I believe we are in the midst of the Biggest Bubble Ever (BBE) across the major asset classes of stocks, bonds, and real estate, with evidence to back up that contention to be presented in future chapters, I’m taking the Cantillon approach.
Reportedly, Richard Cantillon made a fortune shorting Mississippi Company shares and loading up on gold. Since John Law’s company is no longer around to short, I’ll have to make do with U.S. small cap growth stocks instead. Since they trade at over 80x earnings, including the one-third of them that lose money, they’re not a bad substitute. And holding a generous amount of the barbarous relic (gold), along with other hard assets like energy securities, might save skeptically minded investors from the ravages of the latest central bank experimentations with printing press prosperity. But stay tuned--there’s much more to follow on the topic of asset preservation strategies in Chapter 17.
Hi David, thanks for posting these very insightful chapters. This chapter expands a bit on the real estate bubbles. Can you expand a little bit on the rationale behind having "Canadian REITs" on the LIKE category? My impression is that these are highly correlated to the Canadian real estate market, which, in comparison to the US real estate market, seems to be on a bubble of gargantuan scale.
Hi David, thanks for posting these very insightful chapters. This chapter expands a bit on the real estate bubbles. Can you expand a little bit on the rationale behind having "Canadian REITs" on the LIKE category? My impression is that these are highly correlated to the Canadian real estate market, which, in comparison to the US real estate market, seems to be on a bubble of gargantuan scale.