
Bye-Bye, Buyback Bubble?

Completely counterintuitive
Ironically, I originally wrote this chapter of Bubble 3.0 just as Covid was becoming a global threat. I’d started it in late January 2020, and it was published on Valentine’s Day of that year. Amazingly, despite the growing fears that a worldwide pandemic was a distinct possibility, the S&P 500 was merrily bouncing along near its highs.
The question I asked in that issue was: What could possibly bring about the end of the longest running bull market ever seen? As we learned in a matter of weeks, all it took was a global pandemic. By March 22nd, a mere month after the S&P had made a new high and looked impervious to almost any threat, it had tanked by nearly 40%.
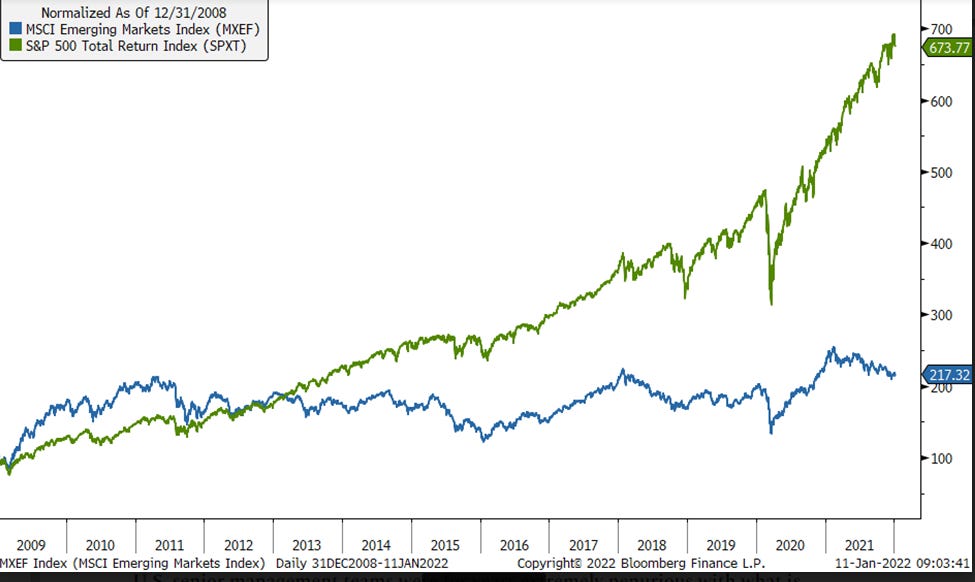
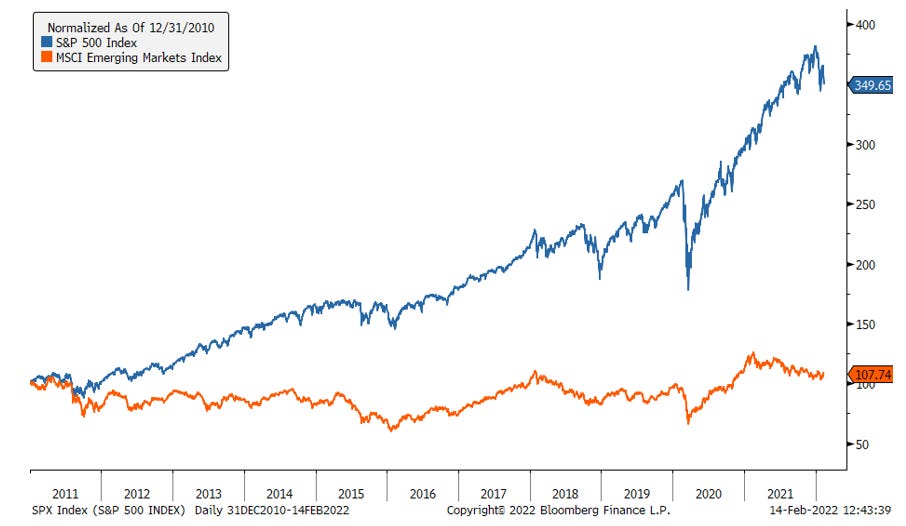
Despite that we now know what it took to stop the long-rampaging bull in its tracks, it’s probably worth pondering what has been the main driver of the extraordinary, and extraordinarily singular, run by the S&P 500 since 2009, particularly, because it’s back in full swing once again. By “singular”, I’m referring to the fact that during the decade leading up to the Covid crash, U.S. stocks have crushed those from almost any other country. Right before the pandemic struck, the main international benchmark excluding the U.S. (the MSCI, ex-U.S.) had essentially flatlined for nearly 14 years.
Figure 1

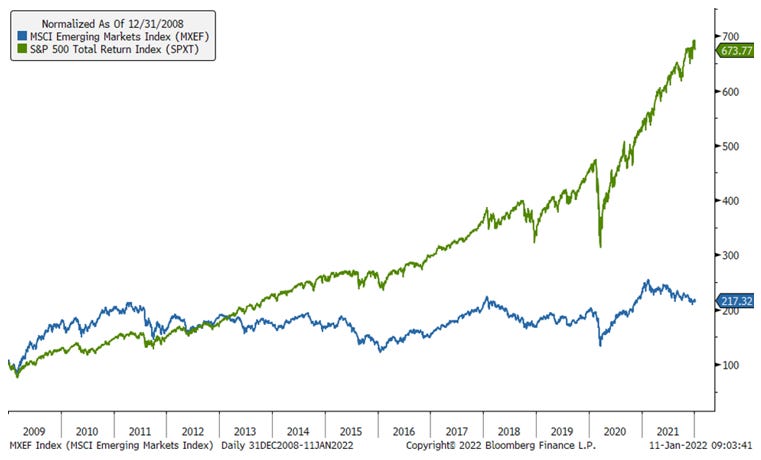
As I have conveyed many times in my newsletter series, this is despite, or perhaps because of, the extreme popularity of international stocks, especially emerging market shares, in the early part of the last decade. Note, however, per Figure 2 below, how much better those had done from the bear market low in 2009 up until 2012, and then the immense lag they’ve seen after that.
Figure 2
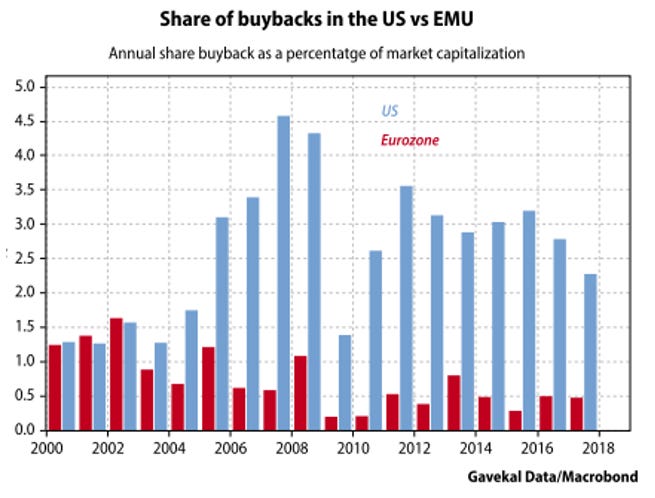
Perhaps it is mere coincidence that over this timeframe U.S. buybacks were running much higher than in the rest of the world… perhaps. Shown below is the U.S. versus Europe, for the period just prior to the Global Financial Crisis and leading up to the pandemic, but the same is true compared to almost every other country. Also on display is a visual indicating that buybacks were the only source of money flowing into stocks for the decade from 2009 to 2019.[i]
Figure 3
The most important developing country for the last 30 years has been, of course, China. And, sure enough, throughout the twenty-teens – i.e., 2010 through 2019 – its economy grew at an 8% annual rate (with some legitimate questions about the accuracy of this number). This was compared to just 2% for America, the unquestionable stock market superstar of the last ten years.
Yet, despite China’s much faster growth — even assuming the real rate was 6% not 8% — its stock market has been a nothing-burger compared to the U.S. For emerging markets overall, it was largely the same story: superior economic growth and much lower stock market returns.
Figure 4
Source: Bloomberg, Evergreen Gavekal
Figure 5
Source: Bloomberg, Evergreen Gavekal
Figure 6
Source: Bloomberg, Evergreen Gavekal
This is consistent with a study of 43 countries from 1997 to 2017 conducted by the Abu Dhabi Investment Authority. Its research found, counterintuitively, that countries with slower economic growth experienced higher stock market returns.
It also discovered that this phenomenon couldn’t be explained by other market-influencing factors such as inflation, currency fluctuations, and/or profit margins. The study conceded these less-material drivers could influence short-term lags or leads but they tended to cancel out over time. Now here’s the kicker that cuts right to the heart of this latest chapter: 80% of the variation was attributable to net buybacks.
A major factor behind this outcome is that faster growing countries need capital to fuel their expansions. This means a combination of debt and equity issuance – or at least it should if a country’s corporations want to keep their balance sheets in order, a point that will be further explored shortly. Ergo, fast economic growth requires large quantities of equity offerings, diluting existing shareholders unless the capital invested earns a satisfactory return.
In countries like China, the government often “encourages” investments perceived to be good for the nation at large but all too frequently don’t earn much for shareholders.[ii] This is almost inarguably a key reason why most Chinese stocks have been such dogs over the past 20 years, despite the economic miracle that country has produced. This has especially been the case with the big State-Owned Enterprises (SOEs) like PetroChina and China Mobile. More nimble and entrepreneurial companies such as Alibaba and Tencent had — emphasis on “had” – rocket rides similar to the U.S. tech stars but they were not included in the official Chinese stock index.
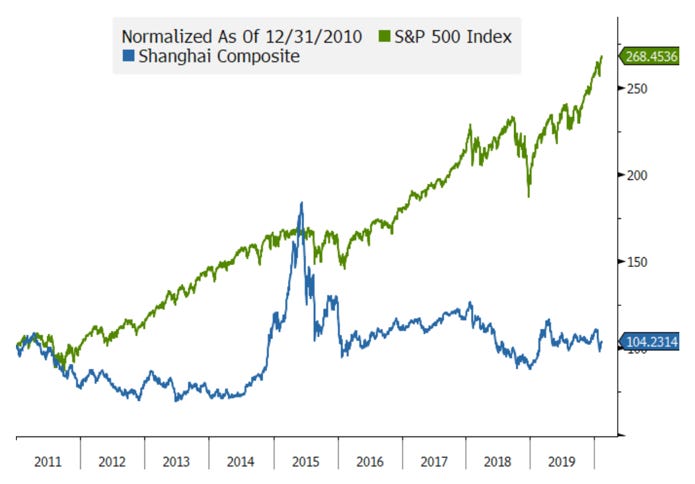
As most investors are aware, China’s long lagging market performance went from disappointing to disastrous in 2021 as its government turned on one sector after another. What initially looked to be a few isolated regulatory crackdowns morphed into a full-fledged and bizarre war against nearly its entire corporate sector. Chinese president Xi Jinping’s wealth equalization initiative, dubbed “common prosperity”, was clearly very hard on common stocks. Consequently, the divergence between the ever-rising U.S. market and China’s main benchmark, the Shanghai Composite, became even more jaw dropping.
Figure 7

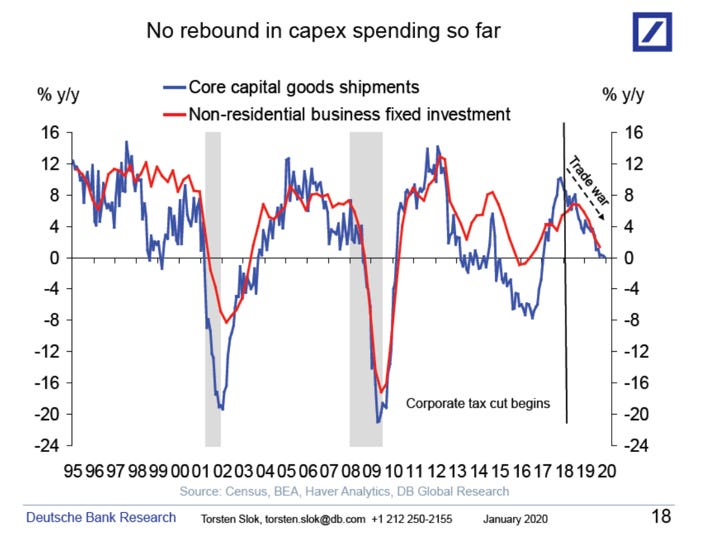
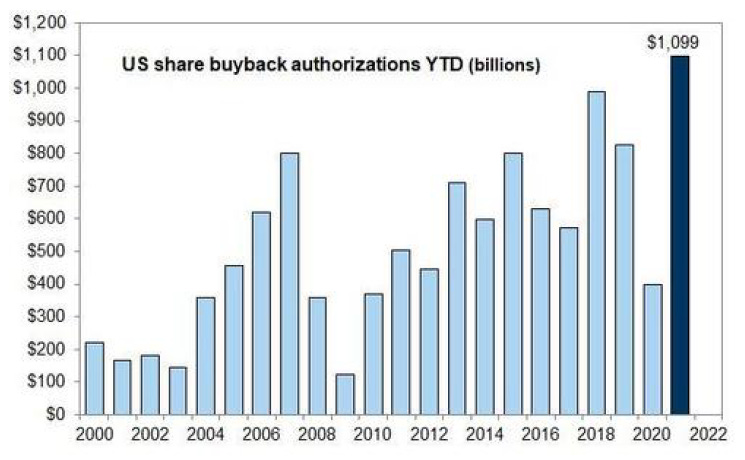
Rather than following the Chinese model of massive investment in new capacity, U.S. senior management teams were for years extremely penurious with what is often referred to as “cap ex”. This was despite 2018’s Donald Trump’s monster corporate tax cut which was supposed to accelerate capital expenditures. In reality, after a brief spurt, their long downtrend continued; however, what truly exploded was the rate of share repurchases, aka, buybacks.
Figure 8
The ultimate rocket fuel
There are those who contend trillions of share buybacks haven’t been the main propellant of this perpetual motion bull market. They insist rising earnings and profit margins have been the key. Undoubtedly, there is truth in that, especially when it comes to the big U.S. tech companies which are beneficiaries of the “network effect”. These included firms such as Apple, Google, Facebook, and Microsoft, where users become either locked-in or quasi-addicted to their services. The cost of acquiring new customers is very low; thus, incremental revenues from adding each newly acquired users flows almost totally to the bottom-line.
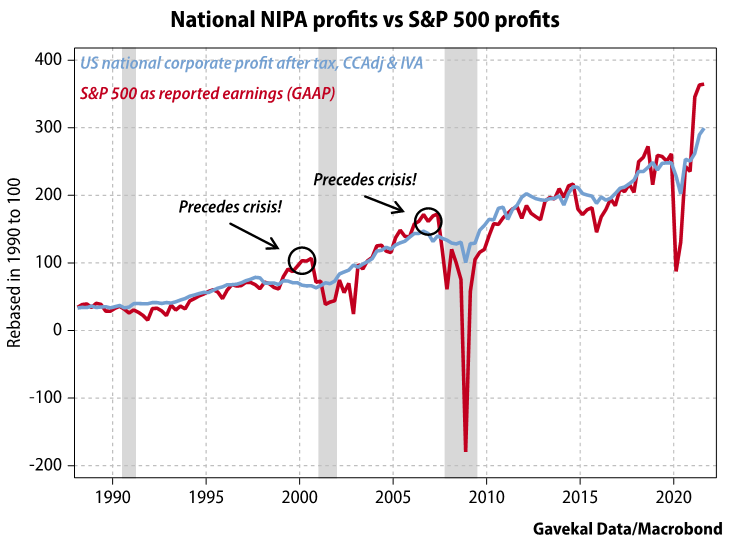
Revealing the disparity between those with a network effect and the rest of corporate America, the broadest measure of economy-wide profits is the NIPA, or National Income and Product Accounts. You can easily see the contrast compared to S&P profits which have been materially boosted by the tech titans’ earnings.
Figure 10
The reality is that very few companies possess the network-effect, high-margin, and rapid-growth profile of the companies often referred to as the FAANGs or FAANGMs (Facebook, Amazon, Apple, Netflix, Google, with Microsoft added in the less catchy alternate version). Thus, outside of this elite group, most of which have trillion-dollar market valuations, if not two trillion (and three trillion, in the case of Apple), profit growth has been mostly uninspiring. Ominously, this happened during what had been the longest, though slowest, economic expansion in American history.[iii]
In addition to tech being the star of the earnings show, it has also been the headliner in the buyback bonanza. However, there is a dark side to this situation. The fact of the matter is that there has been precious little actual share-count reduction for all the trillions expended on repurchases. The tech industry is notorious for lavish options and stock award packages -- especially for senior management, of course.
As Barron’s reported on this in October of 2018 (and is even more true today): “Some market critics like to say that large corporations are cash-management machines for executives. In other words, companies buy back shares, put them into their treasury, and artificially boost earnings per share. Often, they aren’t all retired and a portion of them return to the pool of outstanding shares via executive stock compensation.”
Consequently, despite expending the aforementioned $4 trillion on repurchases, Corporate America only retired about 0.7% (be sure to note the zero-point!) per year of the S&P’s share count over the decade prior to the pandemic. Said differently, $4 trillion of buybacks amounted to at least 20% of the market capitalization, yet the share count has only come down about 8%. Where did the rest go, you might wonder?
Ben Hunt is one of the most iconoclastic newsletter authors I read (and he’s got a lot of competition in my world!). On the eve of the pandemic, Ben wrote a piece called The Rakes, after the name given to the person in a poker game who skims off a small portion of each betting pot. His short essay is a scathing take-down of the buyback mania and he shines a bright, revealing light on the magnitude of the corporate “rake”. This is basically the portion of a repurchase program that goes to insiders.
Even at some of America’s most admired and well-run companies, “the rake” amounts to 25%, or more, of shareholder sums expended. If this isn’t blood-boiling enough, let me share some other relevant factoids on this issue. The SEC has found that insiders sell five times as much stock in the eight days after a buyback announcement relative to ordinary days. Twice as many insiders also dispose of shares in the wake of repurchase declarations.
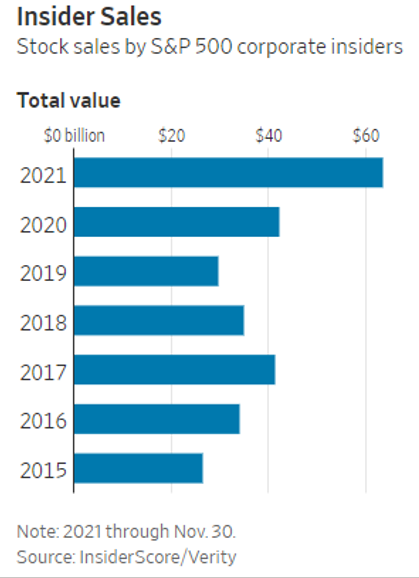
More infuriating yet, the House Financial Services Committee has found that some companies announce buybacks they have no intent of fulfilling in order to juice the stock price just prior to insider sales. The big picture view of this situation is that we have companies repurchasing their shares at a fever pitch while insiders are dumping said shares at an equally feverish rate. Again, please be aware this was leading up to Covid; post-pandemic, insider selling did a nosedive but was running at record levels as 2021 ended.
Figure 11
Source: Goldman Sachs
The fact of the matter is that a roaring bull market is a marvelous, though ultimately impermanent, immunization against the various severe problems afflicting our country presently. When everyone is making plenty of money, why be a spoilsport… unless you’re a congenital contrarian, such as this author?
Now, you might think that “rake” is acceptable if it’s distributing wealth to the rank and file, like through employee stock ownership plans (ESOPs), as well as those at the top of the corporate pyramid. That would be nice, but in the case of this great American company Ben was shining the spotlight on, 97% went to senior management. Because of this entity’s remarkable success in a difficult industry, perhaps such a skew was justified. However, the painful truth is that this happens even at mediocre companies that make up the overwhelming majority of the aforementioned broad profit composite (NIPA). As we’ve seen, this primary measure of America’s corporate net income has pretty much flatlined since the end of 2012. Thus, such lavish senior management compensation seems inappropriate, to put it delicately.
Ben’s note has this concise summation of the set of circumstances we’ve seen over the last decade: “One day we will recognize the defining Zeitgeist of the Obama/Trump years for what it is: an unparalleled transfer of wealth to the managerial class. Not founders. Not entrepreneurs. Not visionaries. Nope… managers. Fee takers. Asset-gatherers. Rent-seekers. Rakes.” (By the way, it doesn’t look any different under the Biden administration, either.)
Another gifted newsletter writer is Jesse Felder, who around the same time wrote a piece titled, Are We Witnessing Another Corporate Earnings Bubble? (Note the word: “Another”.) One of his key points is that the composition of the S&P 500 is different than the overall economy. Highly profitable companies such as tech, financials, and energy are much more heavily represented in the S&P than in the “real world”.
But another leading factor in the divergence is the differing treatment of those pesky stock options that rake off so much shareholder wealth toward senior management. In Jesse’s words: “GAAP accounting, which S&P 500 companies use, allows for a stock option to be granted and then expensed over time using the value of the option at time of the grant. NIPA accounting only expenses the option once it has been exercised, usually at a much later date and with a much higher expense.
In short, it seems that the boost in earnings over the past few years in S&P 500 profits could be, to a large degree, merely a product of the bull market rather than the other way around. Investors have crowded into a smaller number of firms that have inordinately benefitted during the current cycle and, in part, due to this crowding, these same firms have been able to report even greater profits by way of a quirk in stock option accounting.” (For an expanded version of his comments, please see the Chapter 12 Appendix.)
Based on the above, it’s reasonable to conclude that GAAP earnings are overstated and even though Jesse’s foregoing comments are a couple of years old, they are just as true at the dawn of 2022. If he’s right – and I think he is, with more on this topic in Chapter 14 – it means the market’s P/E is understated… and it’s already among the highest of all-time. Perhaps that’s why there is such a disconnect between a P/E ratio that’s high but not record-breaking and the price-to-sales ratio that is far above even early 2000, the peak of the greatest equity bubble ever.
Figure 12
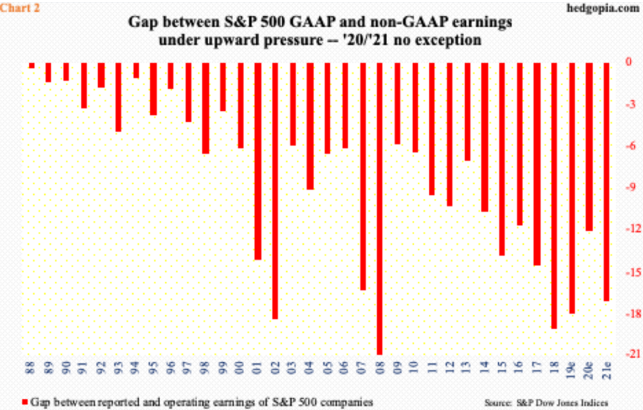
It’s even more disconcerting to realize how many companies spoon-feed non-GAAP earnings numbers to the investing community. Some cynics, like this author, consider those to be profits excluding all the bad stuff. The gap (sorry) between GAAP and non-GAAP has been widening in recent years, as it always does late in an economic and market cycle.
Figure 13
Section II To Be Released March 5th
[i] It’s been a very different story in 2021 and into 2022, despite the rocky start to the new year. Retail flows into stocks have been enormous. These have particularly streamed into the more speculative market corners, often gravitating toward companies that have had scant familiarity with profitability. The rallying cry for emerging markets ten years ago was that they offered a “structurally higher growth rate” versus the heavily indebted and increasingly sclerotic developed countries. This included the best of this ossified bunch, the U.S.
[ii] Other emerging countries also often treat their private sector as an extension of the state, frequently preventing them from earning fair market returns on at least some of their assets. However, China is often the most aggressive practitioner of this approach.
[iii] Moreover, profits for all US companies have been artificially propelled by $6 trillion of federal deficit spending. This creates added demand and without the drag from higher taxes; basically, it is a massive gift to the corporate sector.