
I Hate To Burst Your Retirement Plan Bubble
I Hate To Burst Your Retirement Plan Bubble
Chapter 13, Part I

Chapter 13: I Hate To Burst Your Retirement Plan Bubble
The post-retirement society
Many social commentators, probably rightly, assert that Western culture is in the post-phase: Post-modern, post-religion, post-civility, post-bipartisan, post-patriotic, post-prudence, post-hope, post-tolerance and, perhaps, most inarguably, post-truth. But the “post” that is the topic of this month’s chapter of Bubble 3.0 is based on the thesis that the relatively recent phenomenon of a comfortable retirement is now also increasingly a thing of the past.
One does not have to be a history major to know that it’s only been in the last four or five generations that most individuals in the West were able to plan for financial security during their so-called golden years. In fact, it’s largely been since WWII that the idea of 20 or 30 years (or maybe 40 or 50, if you worked for the Federal government or the State of California) of financially secure leisure after retiring was anything other than a pipe dream for the average person. Unfortunately, we may well be in the process of going full circle in this regard.
One critical aspect that has increasingly gone “post” over the last few decades is the once sacrosanct defined benefit pension plan. (Government workers have largely been shielded from this shift but that may be changing.) In its place, the now nearly ubiquitous 401(k) has emerged as the main retirement asset-builder, especially for private sector workers.
At this point, a brief tutorial is in order. A “defined benefit” plan is exactly what it sounds like: a specific dollar amount per month is provided, typically based on years of service and income earned (up to a maximum threshold). The most familiar and popular version of this is, of course, social security. But in the pre-post-retirement era, it was common for millions of rich country workers to have some kind of guaranteed pension plan…at least if they worked for a medium-to-large-sized company or, of course, for their government. Unfortunately, particularly in the U.S., one of the casualties of the relentless effort by America’s corporate managers to drive down costs has been the once commonplace defined benefit pension.
The lengthening of American lifetimes, at least until recently, also played a role. Obviously, providing a monthly stipend became increasingly costly as life expectancies improved. Combined with the soaring costs of retiree healthcare benefits, U.S. companies tried to do whatever they could to lower their future liabilities. Since it was most challenging to try to get out from under the retiree healthcare burden, at least for current employees, the lower hanging fruit became the defined benefit plan. Thanks to a surging stock market in the 1980s and 1990s, the timing was ideal for a switch to a defined contribution model, typically the now nearly omnipresent 401(k).
The reason this worked so well in an epic bull market is because the high returns it produced accrued to the account beneficiary rather than the plan itself. You may recall it was quite common, especially in the 1990s, for those pension plans that were still in place to have become highly “overfunded”. This allowed companies to defer contributions, often for years, flattering profits. (Companies frequently adopted a two-tier approach where older workers were covered by defined benefit plans while newer and/or younger workers were sent into 401(k) plans. Often, veteran employees were able to keep their previously accrued defined benefit credits while shifting new contributions into 401(k)s.)
But once the tech bubble burst in 2000, it was an entirely new ballgame. Due to the fact that the S&P 500 had become heavily exposed to tech and telecom stocks by the end of 1999, with almost 50% of market value in just those two sectors, the 82% and 73% declines they experienced, respectively, caused the market to be basically cut in half. It was at that time we first heard the sardonic, but not entirely distorted, joke: “My 401(k) is now a 201(k).”
In the past, the ravages of a ferocious bear market would have hit a retirement plan participant’s company and not his or her own account balance. But, as my wife likes to say, “You can’t have it both ways”. Unfortunately, in 2008, after a few good years from 2003 to 2007, it was time for another 50% wipe-out. The 201(k) was back.
However, on the fortunate side, at least for those who didn’t panic during either the Global Financial Crisis of 2008/2009 or 2020’s Covid flash-crash, stocks have experienced one of the best 12 years in history. In fact, the rally has been so powerful that the S&P 500 has now returned 17.55%% per year from the March 2009 trough.
Interestingly, though, going back to the start of the century/millennium, it’s been a not-so-grand or glorious 5.7% per year. This reveals the deleterious impact of the first 10 years, often referred to as the market’s “Lost Decade”. That twenty-year return was less than what long-term treasury bonds were yielding as of 12/31/99 but at least it is now a positive number. As recently as 10/03/2011, it was still negative. (However, in gold terms, stocks are lower than they were at the end of the 1990s, illustrating how much of S&P returns of the last two decades are likely a “money illusion”.)
Readers with a facility for numbers might recognize there’s a glitch with that 5.7%, particularly for the remaining defined benefit pension plans, which includes virtually all state and local retirement programs. Because return assumptions have long been in the 8% to 9% range, a nearly 20-year output of less than 6% from what should be the highest returning portion of plan assets (at least for the publicly traded portion) is more than a bit problematic.
It’s also a safe assumption that most 401(k) plans have struggled to keep pace with this modest return since many participants have an unhelpful tendency to shift into stocks when they’re high and get out after big declines. Furthermore, being diversified in overseas equities has not been a boon. This is due to the fact that the main international benchmark, the ex-U.S. MSCI World Index, has generated a total increase of only 3.8% annually from the end of the 1990s until now. In fact, this index is still 18% below where it traded in 2007.
But back on the sunny side, bonds have helped offset this poor equity showing. Falling interest rates have produced unusually high returns. If one was savvy enough at the end of 1999 to buy a 30-year zero-coupon Treasury bond in their 401(k) — assuming they had that choice (many plans do not offer that option) — the annual gain would have been 9.25%. Other bond-type investments have generated very healthy returns, though not as lofty as a long-term zero-coupon treasury, since those benefit the most from falling – make that collapsing – interest rates. For example, the Merrill Lynch long-term corporate bond index has returned 7.6% per year since the start of the 2000s.
Of course, stocks, at least in the U.S., have been big beneficiaries of the interest rate implosion. This has allowed the S&P 500 to trade within spitting distance of its highest P/E ratio ever and at its loftiest price-to-sales ratio of all-time, as we saw in the last chapter (Chapter 14 will home in on copious amounts of stock market data, with the underlying message being: “Watch out below!”). But it’s a bit scary to contemplate what that sub-par 5.7% return over almost 20 years would have been without such a hurricane-force tailwind from crashing bond yields. Remember, per Chapter 11, we’re now living with the lowest interest rates in 5000 years. Perhaps it’s just my weird way of looking at the world, but I think that’s a rather extraordinary development.
Underscoring the magnitude of the uplift from rising stock and bond prices, particularly in America, please review another chart from a thoroughly illuminating June 23rd, 2021, report by BofA Merrill Lynch. It was pithily titled, Dr. Strange Dove or How You Learned to Stop Worrying and Love the Bond. If nothing else, this graphic points out one of the key rationales for my quixotic endeavor to write Bubble 3.0 and for asserting we are living through the third iteration of hyper-valuation over the last 20 years. Since this piece ran, the below metric has become even more dangerously extended.
Figure 1

Additionally, on the scare-inducing front, is what the overall pension plan funding status would look like if stock valuations weren’t so generous and bond returns hadn’t been unusually luscious. According to Moody’s, along with S&P, one of the two main bond rating services, state and local retirement plans are underfunded to the unpleasant tune of $4.4 trillion. The Fed believes the shortfall is over $6 trillion. To put this in perspective, total state and local government revenues are $3.1 trillion. (Data as of 2019)
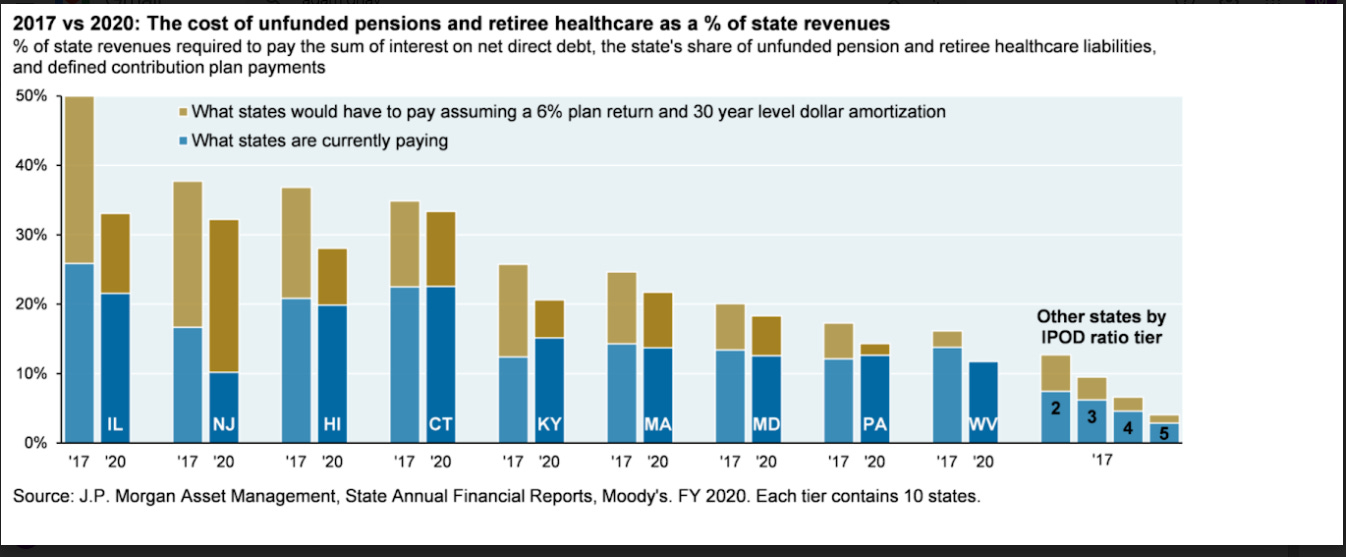
Financial newsletter guru John Mauldin observes, quoting the American Exchange Council, that these plans have only about one-third of the assets they need to fund future benefits. Specific states like Illinois and New Jersey are in such deep holes that a recent JP Morgan (JPM) research piece called their dire conditions “practically irreversible”. To back this up, JPM’s Michael Cembalest ran this graphic showing the percent of state revenues that would need to be dedicated to paying retiree pension and healthcare benefits using lowered but still unlikely-to-be-attained assumptions. Please notice the difference between the blue and brown bars, with the former based on a much more plausible 6% assumed return (more to follow on that point).
Figure 2
The great state of California and the U.S. Federal Government are also interesting case studies on the dangers of rocketing and unfunded entitlements. Thanks to increased taxes on California’s wealthiest, and the capital gains windfall from inflated stock and real estate prices, the Golden State is running a hefty surplus. The federal government has been another crucial source of deliverance, sending $160 billion in aid to the state post pandemic. It has now swung from an estimated $50 billion deficit in the Covid-wracked year of 2020 to a $75 billion surplus for 2021. Yet, there is a powerful storm lurking off its beautiful coastline.
Firstly, its massive public employees’ retirement entity, CalPERS, is only 71% funded despite using a lowered, but nonetheless improbable-to-be-realized, 6.1% return (more to follow on this topic, as well). This is also despite the fact that all the revenue from the “Millionaire’s Tax Initiative” California enacted in 2012, that raised the top rate from 10.3% to 13.3%, has been used to cover retirement benefits.
Secondly, and likely most significantly, Medi-Cal is becoming a tax revenue sinkhole — both for state and national taxpayers. Medi-Cal, California’s version of Medicaid, the health program for the poor, now covers nearly 14 million people, roughly one-third of its total population. It “boasts” an annual budget of $100 billion, three times Illinois’ overall budget. Enrollment is swelling, despite a resurgent economy.
As Medi-Cal has grown, so have emergency room (ER) visits. These vaulted by 75% from 2011 to 2016 which cost, on average, five times as much as a regular doctor visit. Often, trips to the ER are for routine illnesses. ERs are so clogged that Californians are told that if they truly need urgent care, they should call 911 and be taken in an ambulance since this puts them at the head of the ER queue. Obviously, the waste from all the above is immense. Even if you don’t live in California, you should care since the federal government roughly matches what the state spends on Medi-Cal (other states with lower income get even bigger Federal subsidies).
Being originally from Connecticut and knowing state employee retirees here is a generalized comment. These northern, principally blue, states have very generous public employee benefits. Taxes are rising for both property and income to pay for this. However as has been the trend many of these retired state workers are moving to the sunshine belt thus exacerbating the financial ability of "the hand that feeds them". Illinois especially Cook county is the poster child for this. Connecticut has been losing population as well. And who would want to pay the property taxes in New Jersey? In other words there is a limit to the shortfall and that is by moving which Americans have always been able to do.