
The Anti-Bubble Years
The Anti-Bubble Years
Chapter 5, Part I

A flashback to the disco decade
Back in the spring of 2021, as inflation was beginning to look increasingly non-transitory, I shocked my oldest son by telling him that I had been a bond bull almost continually over the past four decades. Because he’s not quite forty himself, this means I have been an optimist about lower interest rates and, related to this, controlled inflation since before he was born. Due to the fact we’ve worked together at Evergreen Gavekal for almost twenty years, I was frankly surprised by his surprise. He then asked me why? What caused me to maintain a bullish stance on bonds for nearly all of the past forty years? That also caught me off-guard; accordingly, I thought it might make an interesting story… and one relevant to Bubble 3.0, the third enormous speculative frenzy of the last quarter-century.
First, though, I’d like to discuss the concept of anti-bubbles. Bubbles themselves now get tremendous amounts of press. Their counterparts, however, don’t. In my 43 years of financial market experience, anti-bubbles are where immense amounts of wealth are made and bubbles are where they are lost.
Admittedly, the bond market does not leap to mind when you think about bubbles or their polar opposite—an asset class that has been in a long and/or ferocious bear market, what I and some others refer to as anti-bubbles. However, another central part of this book is that bonds today are arguably the biggest bubble of all-time. Realizing how much competition there is for that designation these days — such as from a crypto “currency” like Dogecoin — is why I wrote “arguably”.
But when you realize that interest rates are at a 5000-year low, I think it’s fair to say that bond prices are just a tad on the unusual side and have been for years. It’s also critical to be aware that when interest rates fall, bond prices rise. Thus, being at a multi-millennia low in rates means that bonds are also at a 5000-year peak in valuation. Now, I think that qualifies as a top contender for the biggest bubble ever! Because this is another mega-topic that deserves much more coverage, there’s a lot more to follow on bond market absurdities in Chapter 11.
Amazingly, though, this doesn’t preclude a long list of experts, many of whom I respect, from continuing to be bond bullish. To the point of this chapter, I was right there with them… at least until Covid struck. It was the Fed’s response to the pandemic that turned me — and turned me hard, as in, toward hard assets — and away from fixed-income. But, as usual, I’m getting ahead of myself. First, we need to go back, way back to when then-President Jimmy Carter made a crucial decision.
While inflation erupted under Jimmy Carter, it had been in a jagged but decidedly upward trend in the U.S. since the mid-1960s for a variety of reasons: the guns and butter policies of LBJ, increasing unionization, mounting political pressure on the Fed to let the economy run hot and, the ultimate coup de grâce, Richard Nixon’s removal of the Gold Standard in 1971 (as discussed in Chapter 3).
Once the latter occurred, the CPI was off to the races. Former President Nixon, the primary perpetrator of the inflation eruption, tried to get the inflation genie back into its now contents-under-pressure bottle. Against the vehement advice of expert economists like Milton Friedman, Nixon introduced a series of wage and price controls. These worked… briefly. As Dr. Friedman had predicted, once those were lifted, inflation raged again. Consumers and businesses quickly developed a strong distaste for these complex and ineffective intrusions into their lives and the economy. The controls were soon abandoned and by 1974, in the wake of the Watergate scandal, Mr. Nixon gained ex-president status two years ahead of schedule.
The twin energy crises of the 1970s only caused inflation to run all the wilder. As the 1970s came to a close, the U.S. CPI was screaming higher at a year-over-year rate of 13.3%. Shortly thereafter, it briefly receded due to draconian credit controls which were introduced in the winter of 1980, triggering a short but severe recession.
(This author entered the securities industry in early 1979, just in time to witness inflation and interest rates both going bonkers, to use a highly technical term. A slightly more momentous event happened that year than my employment by the former Wall Street firm of Dean Witter[i]: Jimmy Carter’s appointment of Paul Volcker as head of the Federal Reserve.)
In the presidential election year of 1980, the first-half recession was political suicide for Jimmy Carter. Predictably, even though inflation fleetingly crashed down near zero, as soon as the credit restrictions were lifted, the CPI was back in double-digits as the November election approached (in a flashback to the removal of Nixon’s wage and price controls nine years earlier). Also predictably, Ronald Reagan won in a landslide.
Mr. Reagan’s election did nothing to slow inflation initially. The CPI was still running at a double-digit rate early in 1981 and would stay above 10% for nearly the entire year. However, unlike the Fed chairmen who had preceded him for most of the 1970s, Mr. Volcker vowed to get ahead of the inflation curve. Previously, the Fed was constantly playing from behind, largely unable or unwilling to get its key interest-rate weapon, the fed funds rate, above the CPI. Therefore, for most of the ‘70s, short-term interest rates were negative, or minimally positive, in real terms, despite the fact they rose drastically over that decade.
Figure 1
1965 - 1982 CPI YoY vs Effective Fed Funds Rate
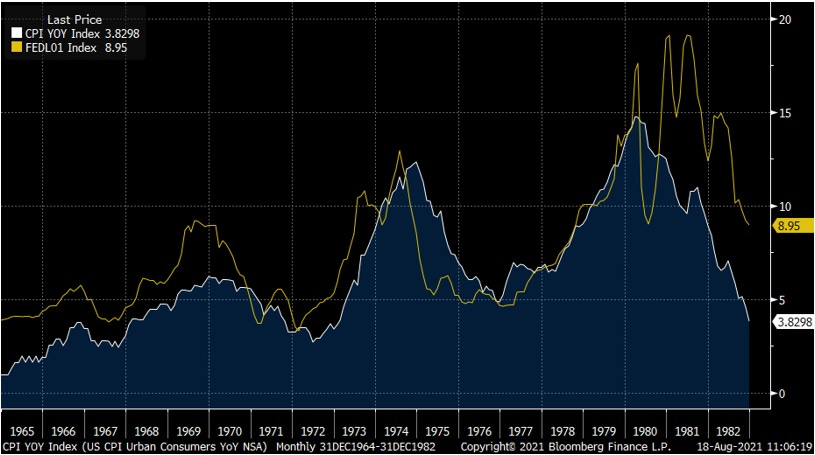
By the end of 1980 and into 1981, it was a very different story. Mr. Volcker pushed the Fed funds rate over 20%. This in turn caused the prime rate (the key borrowing standard) to spike to the previously unimaginable level of 21% by June of 1981. Despite 12% inflation, the real Fed funds rate (the stated rate less the CPI) was roughly 9%. This was a real rate of return — or cost of money, depending on whether you were a lender or borrower — never remotely experienced in the U.S., with the exception of during the darkest days of the Great Depression, when consumer prices were crashing.
Long-term treasury bond yields were in the mid-teens. Even tax-free bonds were yielding 14% or more (I vividly remember this era because I was buying as many for my clients as they would allow). The period from 1966 to 1981 was without rival the worst bear market bonds had ever experienced. It was the ultimate anti-bubble in U.S. history for the normally tranquil and defensive world of debt instruments.
The dark side of these extraordinarily high real interest rates was the worst recession since the 1930s, with unemployment spiking into double digits. The upside was an inflation collapse. By the end of 1982, the CPI was sub-4%, a level not seen since the Nixon wage and price controls. Unlike then, when the inflation contraction was both artificial and brief, this one stuck.
The inflation implosion allowed the Fed to start drastically slashing interest rates. As 1982 came to a close, the Fed funds rate was down to 9%, the lowest it had been since 1979. But there was a huge difference in real terms: In 1979, inflation was also at 9% and rising sharply. Consequently, the real return was zero. This provided a strong incentive for businesses and consumers to keep borrowing and buying hard assets, like real estate and commodities, with the proceeds helping to stoke the inflationary fires.
However, by the end of 1982, the real rate was a still very stiff (or munificent, for lenders) 5%. Therefore, even though the after-inflation rate had come down from its most punitive levels (for borrowers) it remained extremely elevated. Regardless, the collapse in both nominal interest rates and inflation triggered one of the most dramatic financial events in the history of global stock markets. But a bit more market history is needed to fully appreciate what happened in August of 1982.
A bull is born
The Dow Jones Industrial Average had first essentially hit 1000 in 1966 (995). A sideways market then ensued into the early 1970s, with the Dow barely breaking above 1000 (1052) in 1973. This meant that, in after-inflation terms, the stock market had generated seven years of negative returns, at least before factoring in dividends. Even with dividends included, returns were meager net of inflation. (See the Appendix for the return details on this period when America was in the process of falling out of love with stocks.) Then things really got ugly.
The Arab Oil Embargo of October 1973 caused energy prices and inflation to do a moonshot. By the summer of 1974, oil prices had tripled, causing the CPI and the Fed Funds rate to both hit 12%. (Note that, once again, even an extremely high headline, or nominal, interest rate was actually zero relative to inflation.) The venerable Dow was basically cut in half by this twin gut-punch. Nixon’s aforementioned Watergate scandal that drove him from office in August of 1974 only added to the national nightmare, as incoming President Gerald Ford would soon call this period.
The Arab Oil Embargo ended in March of 1974, but stocks kept falling. Even once oil was flowing from the Mideast again, crude prices remained about four times higher than they had been in 1972. Surprisingly, the economy only contracted by 0.5% in 1974, in real terms, despite the oil shock, but that didn’t prevent the worst bear market since the 1930s.
When the market finally hit bottom in December of 1974, the price-earnings ratio on the Dow was down to a microscopic six, thus fully qualifying as a true anti-bubble (the inverse of the conditions prevailing in 2021). This meant the reciprocal of the P/E ratio, the earnings yield, on the Dow was basically 16%. This was the highest it had been since the aftermath of WWII, when many pundits believed the U.S. would enter another depression.[i]
By 1975, inflation had come off the boil and stocks began a cyclical recovery. The Dow increased by 76% from the 1974 nadir to the early 1976 peak at 1015. With dividends included, the total return was 96%. However, the 1973 high of 1052 was not broken for many years to come. As a result, the late 1970s inflation surge would push stock investors’ real return even further into the red.
Figure 2

The next trough was hit in August of 1982 during the aforementioned severe recession induced by Paul Volcker’s do-or-die war on inflation. At that point, the inflation-adjusted total return (i.e., inclusive of dividends) on the Dow and S&P 500 since 1966 was a pathetic minus 45% and minus 29%, respectively, or minus 3.6% and minus 2.1% annually.
On a pure price basis, the Dow lost almost 214% relative to inflation while the S&P eroded 195%. The yawning gap between these real return numbers shows the power of dividends over an extended period. But that was when dividends averaged three times what they do today.
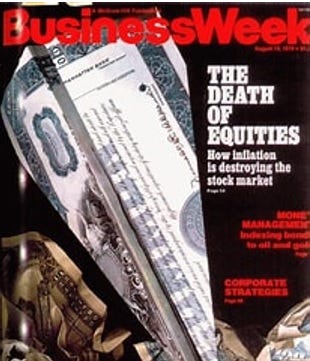
It was during this era that Business Week magazine, as it was called back then (now Bloomberg Business Week), ran its infamous The Death of Equities cover story. With the passage of time, it has become roundly lampooned and frequently cited as a classic contrarian buy-signal. Forty years later, the magazine conceded it was still catching flak over its bearish message.
However, to be fair, it ran on August 19th, 1979, and it factually warned that inflation was greatly harming the stock market. So factual, in reality, that it was merely stating the obvious. And for the next three years, stocks continued to struggle. The total net-of-inflation return on the Dow from when the story ran until August of 1982 was a decidedly negative 20%, or about -6% annually. In other words, it was a pretty decent call, and certainly not deserving of such enduring historical derision. (Many far more poorly timed cover stories have cursed other big-name publications, especially The Economist.)
Figure 3
Moreover, the basic point of the article was spot-on: Inflation was enemy number one for stocks. (It was no coincidence that when the CPI became unanchored in the mid-1960s — and increasingly out-of-control all the way until the early 1980s — that the stock market performed so miserably.) Similarly, it wasn’t a fluke that stocks bottomed almost precisely three years after The Death Of Equities cover story, at a time when investors worldwide were waking up to the reality that a scourge they never thought would end was indeed being largely eradicated, or at least brought to heel.
The stock market lift-off in August of 1982 would go down in the history books for both its duration and its magnitude. Five years after its birth, the raging bull had surged from 776 to 2722 by August of 1987. It would arguably last until the spring of 2000, when the enormous bubble in tech stocks met its pinprick. The reason that it was arguable is what happened in October of 1987 when the market fell nearly 40% in a matter of weeks and almost 23% on Black Monday, October 19th, alone. (As an interesting sidenote, despite the late year crash, the Dow finished plus 5 1/2% for all of 1987; it had been up a bodacious 44% for the year when it hit its August apex.)
Yet, as with the Covid crash in March of 2020, this dramatic interruption of the great bull market was so brief that it’s hard to classify as a true bear market. In hindsight, it was a fleeting panic which didn’t interrupt the long-term up-trend.
By March of 2000, when tech turned into a wreck, both the Dow and the S&P 500 had returned a spectacular 19 1/2 % annually, including dividends, since the August 1982 trough. Even after inflation, returns were in the mid-teens. The NASDAQ, the object of the late 1990s bubble, had produced a 21.4% annual return, including returns of 85% and 101% in 1998 and 1999, respectively.
As usual, investors projected these returns into the new decade; instead, the first decade of this century/millennium saw a negative annual return of 1% on the S&P and 4.9% on the NASDAQ. On an inflation-adjusted basis, it was an even more depressing loss per year of 3.4% and 7.3%, respectively. (Interestingly, after the exceptional returns since 2009, despite sub-par economic growth and America’s stunning loss of stature, investors are once again projecting outstanding returns throughout this present decade.)
Section II To Be Released February 14th
[i] That apprehension was due to the belief that there would be mass unemployment as a result of millions of discharged servicemen; this was in addition to the ultimate “fiscal cliff”, as federal government spending collapsed with the cessation of hostilities.
[i] This once proud firm was subsumed into Morgan Stanley many years later, as was my other long-time Wall Street employer, Smith Barney.
This is a very good series. Thank you! You indicated that Chapter 17 would be about “What to do” about the present bubble. The way things are evolving, Chapter 17 may come too late. Any chance of an early release?
Please release the whole thing as a single PDF rather than sending it as multiple emails