A flashback to the disco decade
Back in the spring of 2021, as inflation was beginning to look increasingly non-transitory, I shocked my oldest son by telling him that I had been a bond bull almost continually over the past four decades. Because he’s not quite forty himself, this means I have been an optimist about lower interest rates and, related to this, controlled inflation since before he was born. Due to the fact we’ve worked together at Evergreen Gavekal for almost twenty years, I was frankly surprised by his surprise. He then asked me why? What caused me to maintain a bullish stance on bonds for nearly all of the past forty years? That also caught me off-guard; accordingly, I thought it might make an interesting story… and one relevant to Bubble 3.0, the third enormous speculative frenzy of the last quarter-century.
First, though, I’d like to discuss the concept of anti-bubbles. Bubbles themselves now get tremendous amounts of press. Their counterparts, however, don’t. In my 43 years of financial market experience, anti-bubbles are where immense amounts of wealth are made and bubbles are where they are lost.
Admittedly, the bond market does not leap to mind when you think about bubbles or their polar opposite—an asset class that has been in a long and/or ferocious bear market, what I and some others refer to as anti-bubbles. However, another central part of this book is that bonds today are arguably the biggest bubble of all-time. Realizing how much competition there is for that designation these days — such as from a crypto “currency” like Dogecoin — is why I wrote “arguably”.
But when you realize that interest rates are at a 5000-year low, I think it’s fair to say that bond prices are just a tad on the unusual side and have been for years. It’s also critical to be aware that when interest rates fall, bond prices rise. Thus, being at a multi-millennia low in rates means that bonds are also at a 5000-year peak in valuation. Now, I think that qualifies as a top contender for the biggest bubble ever! Because this is another mega-topic that deserves much more coverage, there’s a lot more to follow on bond market absurdities in Chapter 11.
Amazingly, though, this doesn’t preclude a long list of experts, many of whom I respect, from continuing to be bond bullish. To the point of this chapter, I was right there with them… at least until Covid struck. It was the Fed’s response to the pandemic that turned me — and turned me hard, as in, toward hard assets — and away from fixed-income. But, as usual, I’m getting ahead of myself. First, we need to go back, way back to when then-President Jimmy Carter made a crucial decision.
While inflation erupted under Jimmy Carter, it had been in a jagged but decidedly upward trend in the U.S. since the mid-1960s for a variety of reasons: the guns and butter policies of LBJ, increasing unionization, mounting political pressure on the Fed to let the economy run hot and, the ultimate coup de grâce, Richard Nixon’s removal of the Gold Standard in 1971 (as discussed in Chapter 3).
Once the latter occurred, the CPI was off to the races. Former President Nixon, the primary perpetrator of the inflation eruption, tried to get the inflation genie back into its now contents-under-pressure bottle. Against the vehement advice of expert economists like Milton Friedman, Nixon introduced a series of wage and price controls. These worked… briefly. As Dr. Friedman had predicted, once those were lifted, inflation raged again. Consumers and businesses quickly developed a strong distaste for these complex and ineffective intrusions into their lives and the economy. The controls were soon abandoned and by 1974, in the wake of the Watergate scandal, Mr. Nixon gained ex-president status two years ahead of schedule.
The twin energy crises of the 1970s only caused inflation to run all the wilder. As the 1970s came to a close, the U.S. CPI was screaming higher at a year-over-year rate of 13.3%. Shortly thereafter, it briefly receded due to draconian credit controls which were introduced in the winter of 1980, triggering a short but severe recession.
(This author entered the securities industry in early 1979, just in time to witness inflation and interest rates both going bonkers, to use a highly technical term. A slightly more momentous event happened that year than my employment by the former Wall Street firm of Dean Witter[i]: Jimmy Carter’s appointment of Paul Volcker as head of the Federal Reserve.)
In the presidential election year of 1980, the first-half recession was political suicide for Jimmy Carter. Predictably, even though inflation fleetingly crashed down near zero, as soon as the credit restrictions were lifted, the CPI was back in double-digits as the November election approached (in a flashback to the removal of Nixon’s wage and price controls nine years earlier). Also predictably, Ronald Reagan won in a landslide.
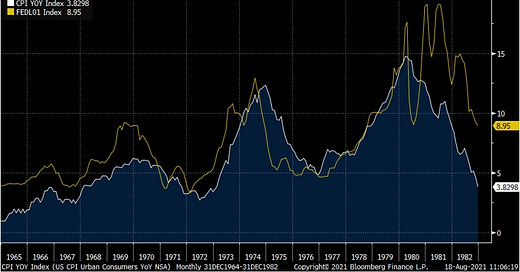
Mr. Reagan’s election did nothing to slow inflation initially. The CPI was still running at a double-digit rate early in 1981 and would stay above 10% for nearly the entire year. However, unlike the Fed chairmen who had preceded him for most of the 1970s, Mr. Volcker vowed to get ahead of the inflation curve. Previously, the Fed was constantly playing from behind, largely unable or unwilling to get its key interest-rate weapon, the fed funds rate, above the CPI. Therefore, for most of the ‘70s, short-term interest rates were negative, or minimally positive, in real terms, despite the fact they rose drastically over that decade.
Figure 1
1965 - 1982 CPI YoY vs Effective Fed Funds Rate
By the end of 1980 and into 1981, it was a very different story. Mr. Volcker pushed the Fed funds rate over 20%. This in turn caused the prime rate (the key borrowing standard) to spike to the previously unimaginable level of 21% by June of 1981. Despite 12% inflation, the real Fed funds rate (the stated rate less the CPI) was roughly 9%. This was a real rate of return — or cost of money, depending on whether you were a lender or borrower — never remotely experienced in the U.S., with the exception of during the darkest days of the Great Depression, when consumer prices were crashing.
Long-term treasury bond yields were in the mid-teens. Even tax-free bonds were yielding 14% or more (I vividly remember this era because I was buying as many for my clients as they would allow). The period from 1966 to 1981 was without rival the worst bear market bonds had ever experienced. It was the ultimate anti-bubble in U.S. history for the normally tranquil and defensive world of debt instruments.
The dark side of these extraordinarily high real interest rates was the worst recession since the 1930s, with unemployment spiking into double digits. The upside was an inflation collapse. By the end of 1982, the CPI was sub-4%, a level not seen since the Nixon wage and price controls. Unlike then, when the inflation contraction was both artificial and brief, this one stuck.
The inflation implosion allowed the Fed to start drastically slashing interest rates. As 1982 came to a close, the Fed funds rate was down to 9%, the lowest it had been since 1979. But there was a huge difference in real terms: In 1979, inflation was also at 9% and rising sharply. Consequently, the real return was zero. This provided a strong incentive for businesses and consumers to keep borrowing and buying hard assets, like real estate and commodities, with the proceeds helping to stoke the inflationary fires.
However, by the end of 1982, the real rate was a still very stiff (or munificent, for lenders) 5%. Therefore, even though the after-inflation rate had come down from its most punitive levels (for borrowers) it remained extremely elevated. Regardless, the collapse in both nominal interest rates and inflation triggered one of the most dramatic financial events in the history of global stock markets. But a bit more market history is needed to fully appreciate what happened in August of 1982.
A bull is born
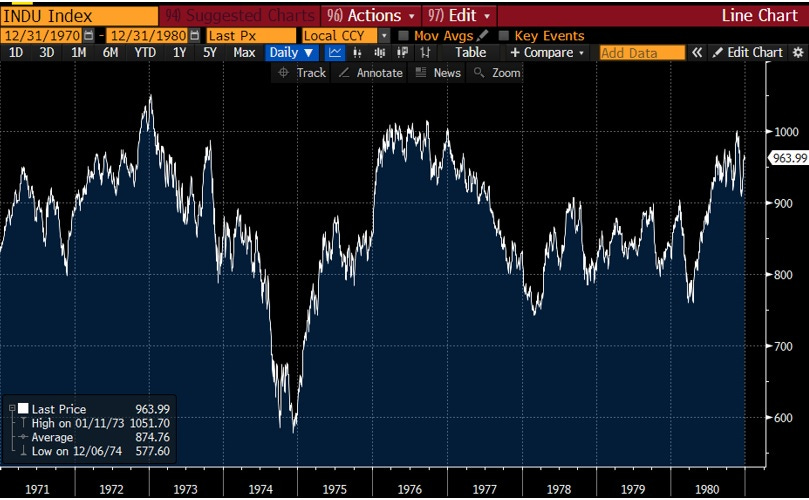
The Dow Jones Industrial Average had first essentially hit 1000 in 1966 (995). A sideways market then ensued into the early 1970s, with the Dow barely breaking above 1000 (1052) in 1973. This meant that, in after-inflation terms, the stock market had generated seven years of negative returns, at least before factoring in dividends. Even with dividends included, returns were meager net of inflation. (See the Appendix for the return details on this period when America was in the process of falling out of love with stocks.) Then things really got ugly.
The Arab Oil Embargo of October 1973 caused energy prices and inflation to do a moonshot. By the summer of 1974, oil prices had tripled, causing the CPI and the Fed Funds rate to both hit 12%. (Note that, once again, even an extremely high headline, or nominal, interest rate was actually zero relative to inflation.) The venerable Dow was basically cut in half by this twin gut-punch. Nixon’s aforementioned Watergate scandal that drove him from office in August of 1974 only added to the national nightmare, as incoming President Gerald Ford would soon call this period.
The Arab Oil Embargo ended in March of 1974, but stocks kept falling. Even once oil was flowing from the Mideast again, crude prices remained about four times higher than they had been in 1972. Surprisingly, the economy only contracted by 0.5% in 1974, in real terms, despite the oil shock, but that didn’t prevent the worst bear market since the 1930s.
When the market finally hit bottom in December of 1974, the price-earnings ratio on the Dow was down to a microscopic six, thus fully qualifying as a true anti-bubble (the inverse of the conditions prevailing in 2021). This meant the reciprocal of the P/E ratio, the earnings yield, on the Dow was basically 16%. This was the highest it had been since the aftermath of WWII, when many pundits believed the U.S. would enter another depression. [ii]
By 1975, inflation had come off the boil and stocks began a cyclical recovery. The Dow increased by 76% from the 1974 nadir to the early 1976 peak at 1015. With dividends included, the total return was 96%. However, the 1973 high of 1052 was not broken for many years to come. As a result, the late 1970s inflation surge would push stock investors’ real return even further into the red.
Figure 2
The next trough was hit in August of 1982 during the aforementioned severe recession induced by Paul Volcker’s do-or-die war on inflation. At that point, the inflation-adjusted total return (i.e., inclusive of dividends) on the Dow and S&P 500 since 1966 was a pathetic minus 45% and minus 29%, respectively, or minus 3.6% and minus 2.1% annually.
On a pure price basis, the Dow lost almost 214% relative to inflation while the S&P eroded 195%. The yawning gap between these real return numbers shows the power of dividends over an extended period. But that was when dividends averaged three times what they do today.
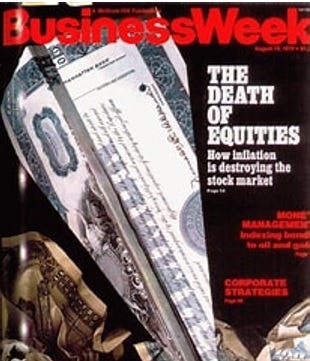
It was during this era that Business Week magazine, as it was called back then (now Bloomberg Business Week), ran its infamous The Death of Equities cover story. With the passage of time, it has become roundly lampooned and frequently cited as a classic contrarian buy-signal. Forty years later, the magazine conceded it was still catching flak over its bearish message.
However, to be fair, it ran on August 19th, 1979, and it factually warned that inflation was greatly harming the stock market. So factual, in reality, that it was merely stating the obvious. And for the next three years, stocks continued to struggle. The total net-of-inflation return on the Dow from when the story ran until August of 1982 was a decidedly negative 20%, or about -6% annually. In other words, it was a pretty decent call, and certainly not deserving of such enduring historical derision. (Many far more poorly timed cover stories have cursed other big-name publications, especially The Economist.)
Figure 3
Moreover, the basic point of the article was spot-on: Inflation was enemy number one for stocks. (It was no coincidence that when the CPI became unanchored in the mid-1960s — and increasingly out-of-control all the way until the early 1980s — that the stock market performed so miserably.) Similarly, it wasn’t a fluke that stocks bottomed almost precisely three years after The Death Of Equities cover story, at a time when investors worldwide were waking up to the reality that a scourge they never thought would end was indeed being largely eradicated, or at least brought to heel.
The stock market lift-off in August of 1982 would go down in the history books for both its duration and its magnitude. Five years after its birth, the raging bull had surged from 776 to 2722 by August of 1987. It would arguably last until the spring of 2000, when the enormous bubble in tech stocks met its pinprick. The reason that it was arguable is what happened in October of 1987 when the market fell nearly 40% in a matter of weeks and almost 23% on Black Monday, October 19th, alone. (As an interesting sidenote, despite the late year crash, the Dow finished plus 5 1/2% for all of 1987; it had been up a bodacious 44% for the year when it hit its August apex.)
Yet, as with the Covid crash in March of 2020, this dramatic interruption of the great bull market was so brief that it’s hard to classify as a true bear market. In hindsight, it was a fleeting panic which didn’t interrupt the long-term up-trend.
By March of 2000, when tech turned into a wreck, both the Dow and the S&P 500 had returned a spectacular 19 1/2 % annually, including dividends, since the August 1982 trough. Even after inflation, returns were in the mid-teens. The NASDAQ, the object of the late 1990s bubble, had produced a 21.4% annual return, including returns of 85% and 101% in 1998 and 1999, respectively.
As usual, investors projected these returns into the new decade; instead, the first decade of this century/millennium saw a negative annual return of 1% on the S&P and 4.9% on the NASDAQ. On an inflation-adjusted basis, it was an even more depressing loss per year of 3.4% and 7.3%, respectively. (Interestingly, after the exceptional returns since 2009, despite sub-par economic growth and America’s stunning loss of stature, investors are once again projecting outstanding returns throughout this present decade.)
The birth of another bull
The epic bull run from 1982 to early 2000 was the biggest of all-time. But it wasn’t just stocks that were superstars. The bond market was, in its own way, even more spectacular. Thirty-year maturity treasury bonds bestowed upon the handful of intrepid investors who were willing to buy them at their yield peak in 1981, when they were derisively called “certificates of confiscation”, a per year return of 9.5%. On a risk-adjusted basis versus stocks, they actually beat the S&P 500 by 1.5% annually. (Bonds are less volatile, or risky, than stocks and, thus, are expected to have a lower return but with much milder fluctuations; this calculation makes that adjustment.)
There is no doubt the collapse in yields during the period from 1982 to 2000 turbo-charged the great equity bull market. This was despite the fact that long-term treasury bonds were still yielding around 6% in March of 2000 when the nearly 18-year bull run finally expired. This is in contrast to less than 2% on the 30-year treasury bond at year-end 2021.
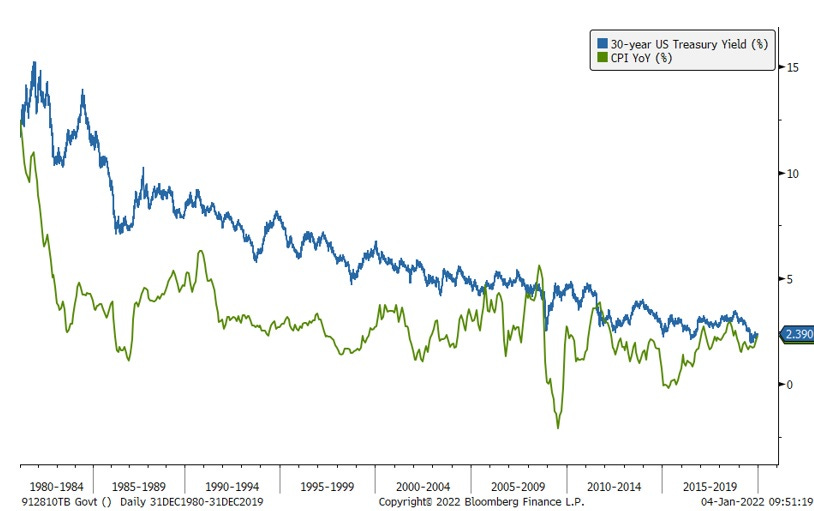
Returning to the question of why, for nearly 40 years, I was almost always bullish to very bullish on bonds, it was in no small part due to the fact that interest rates were largely positive even after inflation. As you can see below, there were very few instances during this era, at least until the post-financial crisis timeframe, when real interest rates were not reasonably positive. Consequently, as a bondholder, you actually got paid to hold them, a refreshingly quaint, but also increasingly rare, notion.
Figure 4
Additionally, and similarly, inflation was under consistent downward pressure. There was a multitude of factors through this four-decade period that would keep it in check, if not push it even lower, and I was a believer in their sustainability.
This is a major topic, and it would take an entire book to do it justice, but I will try to summarize what I believe were among the major disinflationary forces. First up, was the decline of union power. It’s a statement of fact that the significant reduction in collective bargaining over the past half-century was behind the trends seen in the chart below. Union membership for the overall U.S. workforce fell from 29% in the 1970s to 11% today. It’s hard to argue this wasn’t behind a shift in the de facto profits split between businesses and labor.
Figure 5
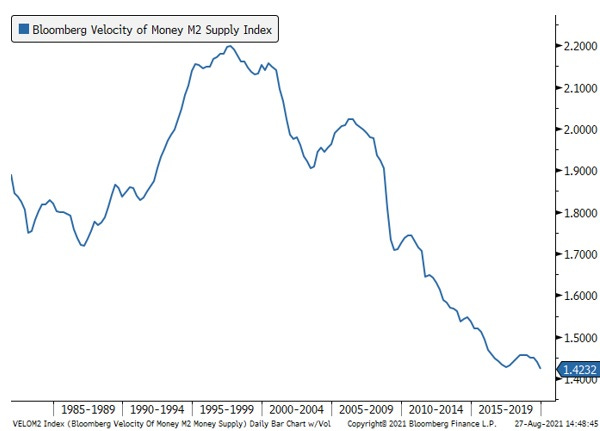
Second, was the long-term erosion in the velocity of money. With its turnover rate in a persistent slide, it made a serious burst of inflation highly unlikely, at least of a lasting nature. It is worth noting that money velocity stopped falling for most of 2021 despite an enormous increase in the money supply; in my mind, this implies an important sea change may be underway. It may also be a key factor for why inflation has so totally wrong-footed the Fed. (For more on money velocity, see the Glossary and/or the Appendix for this chapter.)
Figure 6
Another exceedingly powerful factor in keeping the CPI muted was the ascent of China as a global export tour de force. The shift of production of almost everything to its shores, and the related emergence of what became known as “the China price”, resulted in actual deflation for many goods. This was heaven for U.S. consumers but often hell for U.S. producers. Entire industries were relocated from the American heartland to the Chinese mainland.
This was allowed by U.S. policymakers to unfold over decades, resulting in massive trade deficits and the loss of millions of high-paying jobs. But it certainly lowered consumer prices in the U.S. The ramifications of that laissez-faire attitude toward globalization, China-style, obviously came to a head under Donald Trump and are continuing with the Biden administration. There is little question that the model of having supply chains halfway around the world in ultra-low-cost venues is under siege. As others have noted, the world is moving from just-in-time to just-in-case inventories.
Demographics also played a starring role in the taming of inflation saga. As tens of millions of Baby Boomers have aged, we’ve tended to spend less and save more (I’m smack dab in the middle of the Boomer generation, hence the “we”).
Two oil busts in the last decade also exerted downward pressure on the CPI. Based on how pervasive energy is throughout the global economy, this has been a significant disinflationary — and, at times, deflationary — force.
Admittedly, this is a very short and simplistic summation of an extremely complex subject, and they are all fairly mainstream views of the victory over high inflation that started under Paul Volcker. The exception on the obvious front might be money velocity, which is somewhat esoteric, but crucial in my view. (See the Appendix for Chapter 4 to brush up on this factor).
There was another more unique explanation for the subjugation of inflation that was perhaps the main reason I was for so many years a bond bull, with a few exceptions, mostly during the late innings of economic up-cycles. This has to do with the thermostatic effect of interest rates, at least when they were allowed to be set by market forces (i.e., totally unlike today).
This concept views interest rates/bond yields as the thermostat; when the economy got too hot, the bond market would fall in price[iii], raising the economy-wide cost of money. Such a reaction would depress borrowing, which had a cooling ripple effect. If the rate rise was severe enough, widespread bankruptcies often occurred, leading to recessions and, frequently, actual deflation in some goods and services. [iv]
Such a drastic cool-down, to the point of freezing portions of the economy, can have a pronounced, even terrifying, impact. For example, consider what happened to housing in 2007 and 2008 when mortgage rates soared, and home financing became nearly unavailable for a time. Financial ice storms such as this cause the Fed to heat things back up by cutting short-term interest rates. Longer-term, market-driven rates also plunge. Before long, the credit crunch eases and economic growth resumes. Inflation consistently falls, sometimes hard, during these glacial phases. Even in the inflationary 1970s, the 1974 recession cut inflation down by almost 60%.
There is yet another, much more cynical, explanation of why inflation has been in such a prolonged dormant phase. This focuses on the way the U.S. government measures the CPI. Starting in 1996, the official arbiter of inflation, the Bureau of Labor Statistics, changed its methodology to what is called chain-weighted.
What this non-descriptive term means in a practical sense is that consumers can switch to cheaper goods when prices for some consumer items increase. Thus, when the price of filet mignon is rising rapidly, consumers can switch to something cheaper, like pork. Another related example is that, in 2021, many were forced to shop at so-called “dollar stores” versus traditional grocery stores due to soaring food prices.
Most economists seem to have accepted the government’s contention that this is a more accurate way to measure inflation. However, others are much less certain. Perhaps a better name would be “the substitution effect”, or maybe “the trading down effect” but, regardless, when high prices cause consumers to make an inferior preference choice due to rising prices, that seems to me like a negative. And this leads to another way in which the government has controversially suppressed inflation—hedonics.
Hedonic adjustments attempt to take into account superior quality. Whether it’s air bags in cars or vastly improved computing power in cell phones, the idea is that if the price goes up but the quality improves more so, then the true cost has actually fallen. With technology, quality is often staggeringly greater while the cost of almost everything tech-related has crashed. Tech’s inherently deflationary nature has been another material, and totally legitimate, depressant on the overall CPI.
Clearly, hedonic adjustments are tricky and subjective. Further, they seem the opposite of chain-weighted, where there is arguably the need to create an adjustment for consumers moving down the quality chain. (There is a related stealth influence called “shrinkflation” of which we’ve all been the victim — same price but smaller number of items per package. I’m not sure government statisticians are on top of that ploy.)
One last critical inflation dampener has been housing, oddly enough — in fact, very oddly enough. As we all know, in most regions home prices have gone postal over the last twenty years, despite the 2008 -2009 crash. This has, in turn, priced millions of young people out of the housing market. It has also pushed up rents in a big way. Based on these realities, one would think that housing should have been an upside driver of the CPI. But not according to our infallible central bank.
The Fed’s preferred inflation measure — the PCE, which stands for “Personal Consumption Expenditures” — attributes a much lower weighting to shelter costs than does the CPI. Moreover, it uses something it calls Owner’s Equivalent Rent (OER) which asks a sample set of homeowners how much they believe their home would rent for if they leased it out. If you think that sounds less than precise, I’m right there with you.
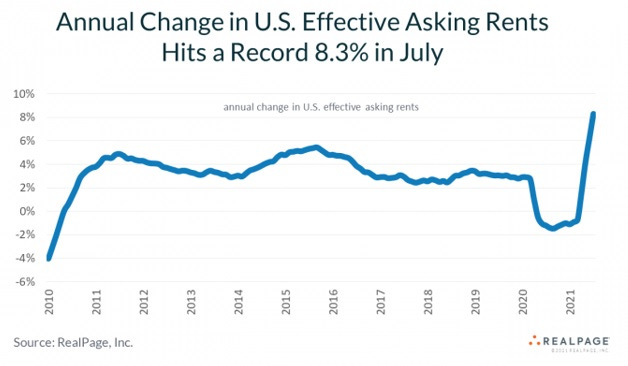
This methodology has almost certainly drastically understated housing cost inflation, particularly since 2000 when, as we saw in Chapter 4, home values began to far exceed the CPI. Since shelter costs are around 40% of the CPI, this is highly significant. Post-Covid, this approach created even more divergence versus reality, especially once rent abatements have begun to roll off. Rents were rising at a record clip in 2021, as you can see in the below chart, 17% above the prior lease rate overall. (Possible to make the chart text bigger? Or we can get by with just the second chart, figure 8)
Figure 7
Figure 8
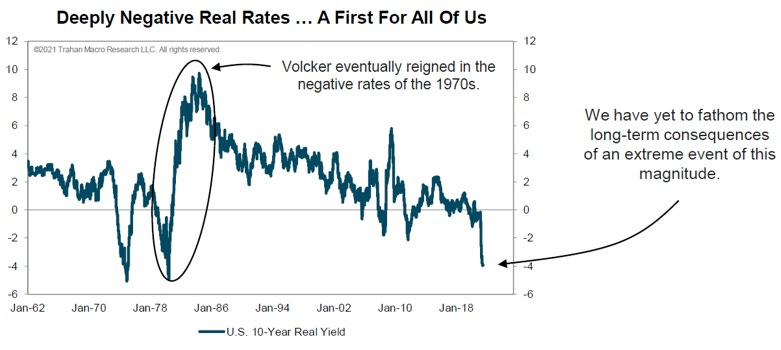
In summary, most of the factors that have kept inflation subdued appear to be either weakening or outright reversing. This paradigm shift is increasingly looking much more enduring than the Fed believes… or wants the markets to believe. Yet, long-term treasury bonds are trading at the most negative yields since the 1970s, implying investors are buying into the Fed’s transitory inflation meme.
Figure 9
Figure 10
As a result, even though bond yields soared from their 2020 lows (around 0.50% on the 10-year T-note), for the first time since 1981, I was not impressed. Even when the 10-year hit its recent peak of 1.75% in the spring of 2021, it was hard to muster any enthusiasm for that puny yield; however, it did rise sharply in price, lowering the yield to 1.25% by late August of 2021. Accordingly, it was, as they say, a tradeable rally. But I have a hard time playing that game, especially when there are myriad inflationary winds beginning to blow, even howl.
As recently as late 2018, when the Fed had been raising rates for several years, the 10-year T-note yield moved about 1.2% higher than inflation — 3% versus roughly 1.8% inflation. It was also possible to get close to a 5% yield on investment grade corporate debt, generating an even more positive real return. (My team and I once again used this bond selloff to extend the maturities of our clients’ bond portfolios, something I have done in every bond bear market since the early 1980s. Now, however, I am beginning to wonder if I’ll ever get this opportunity again, based on current Fed policies.)
As 2019 unfolded, the yield curve (the difference between short-term and long-term rates) became inverted; in other words, short rates moved above longer rates. This is an unusual occurrence, but it does happen when the Fed has been tightening for an extended time and the bond market begins to sniff out a slowdown or, usually, a recession. In fact, an inverted yield curve is one of the best recession predictors around — far better than the Fed, which, once again, has failed to warn of a single economic contraction. (Since WWII, there have been nine yield curve inversions and eight of these were followed by recessions in relatively short order. Thus, the yield curve’s batting average has been .889 versus the Fed’s at .000)
This warning signal worked once again; in mid-2020, the National Bureau of Economic Research (NBER), the official recession arbiter, declared that a contraction had begun in March. This confirmed the recessions in corporate profits and industrial production that was already underway in 2019. (Of course, the Fed failed to anticipate its arrival in any of their press conferences and even in their internal meeting minutes, at least those that have been released thus far, on the usual delayed basis.)
Unquestionably, Covid turned what was likely a mild contraction into one of the deepest ever; however, the NBER has now determined it was also the shortest. According to its analysis, the Covid recession ended in April of last year (other sources opine that it lasted for three months; regardless, it was exceptionally short-lived). This coincided with the briefest bear market in stocks ever seen.
As mentioned in Chapter 2, it was the Fed’s announcement in late March of 2020 that it would buy corporate debt which triggered the furious bull market and ended the Covid recession, despite the on-going lockdowns. Again, this fulfilled one of my most far-fetched predictions: namely, that the Fed would bring down credit spreads during the next crisis (however, it also stated it would buy junk bonds, which I didn’t expect).
Ironically, and also as I speculated as far back as 2008, it actually didn’t need to purchase large quantities of corporate bonds to cause credit spreads to collapse. By the time the program was closed down by the Treasury Department at the end of 2020 — over the Fed’s objections — a mere $14 billion was actually acquired. This is in contrast to the $5 trillion the Fed has bought, via its Magical Money Machine, of U.S. treasuries and mortgage-backed securities since the pandemic hit. Just the idea that the Fed had the corporate bond market’s back was enough to produce the credit spread plunge seen below. (Falling corporate spreads mean that private-sector bond prices are rising relative to Treasuries; this process has an extremely powerful and beneficial impact on asset prices, as well as borrowing conditions.)
Figure 11
Consequently, as 2021 drew to a close, a bond investor was faced with a situation 180° removed from the time in 1981 when I first became a bull on bonds. Instead of a real rate of return far above inflation, investors were facing yields that lose money each and every year, even if the Fed’s 2% inflation target can be maintained. If I’m right, and we’re facing much higher consumer price increases than that, bonds will be “certificates of confiscation” to a degree they haven’t been since the 1970s.
Similarly, corporate spreads are down to levels that offer little compensation for default risk. This is particularly true with junk bonds which now, for the first time in history, also have negative real yields. (Obviously, junk bonds have far greater default risk than investment grade debt but even the latter sometimes go belly-up.)
My love affair with the bond market has been a long and blissful one. There were times when I would briefly jilt it, such as late in an economic expansion as inflation was heating up and the Fed was just beginning to tighten. But this time is different — very, very different, in my view. Those are always dangerous words to utter in the financial markets. But, then again, when was there a time, outside of war, when the U.S. government was engaged in Modern Monetary Theory?
In Chapter 9, we will examine an inflationary force that, in my mind, has the potential — in fact, I’d say probability — of being the greatest of them all. Moreover, it’s one that very few pundits and financial narrative-spinners are discussing.
[i] This once proud firm was subsumed into Morgan Stanley many years later, as was my other long-time Wall Street employer, Smith Barney.
[ii] That apprehension was due to the belief that there would be mass unemployment as a result of millions of discharged servicemen; this was in addition to the ultimate “fiscal cliff”, as federal government spending collapsed with the cessation of hostilities.
[iii] Bond prices and yields are like a teeter-totter. When prices fall, yields rise and vice versa.
[iv] Oddly, when the Fed has been on long tightening campaigns and rates have risen considerably, most bond investors are typically reluctant to extend “duration”, a fancy way of saying buying longer maturity debt. This reluctance costs them dearly in terms of forfeiting the opportunity to lock in high yields for years to come.
